
Ambient Groundwater Quality Monitoring
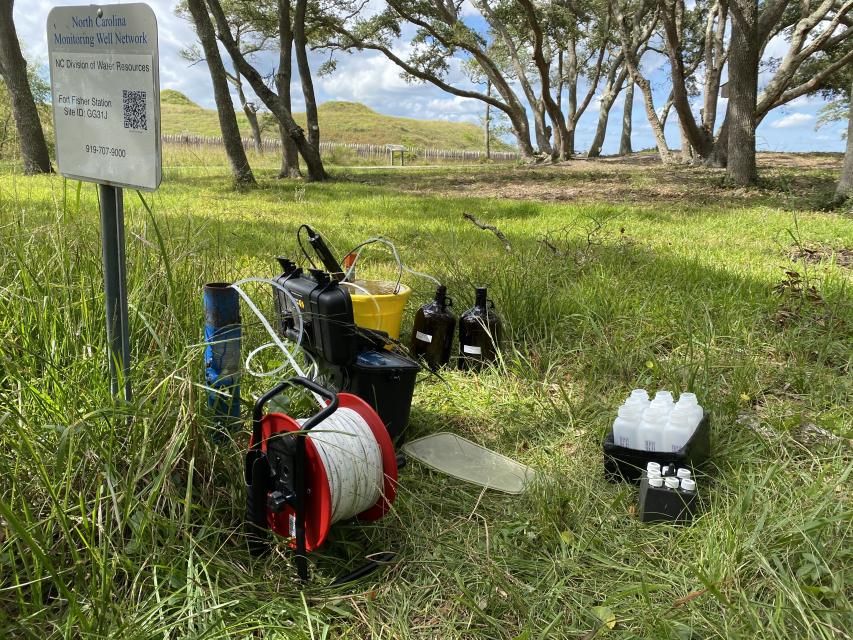
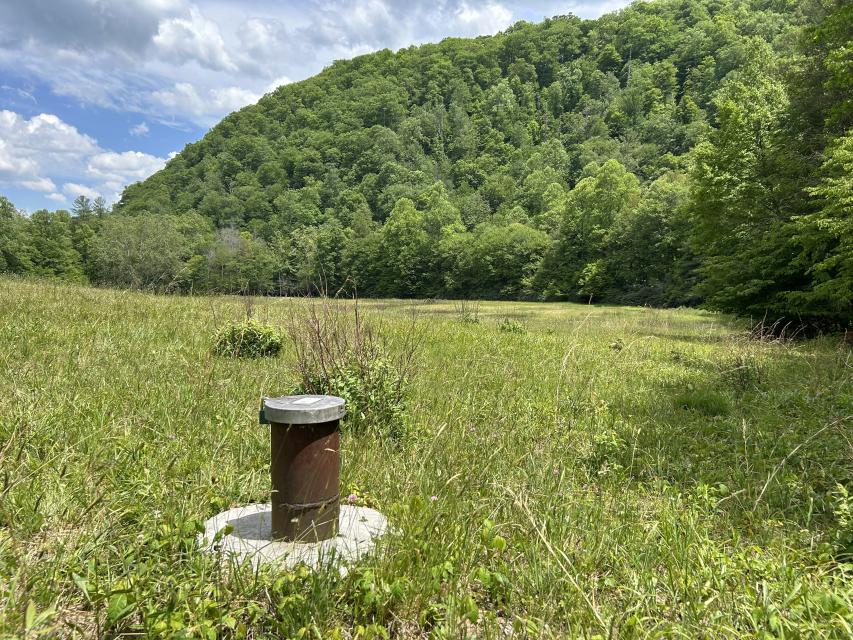
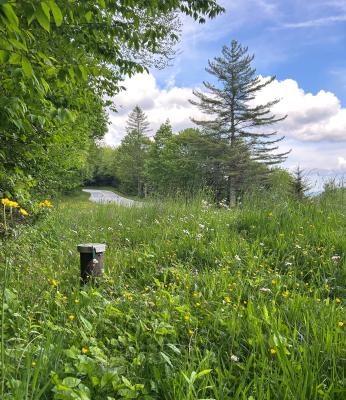
Groundwater Resources Branch (GWRB) staff assess ambient groundwater quality throughout North Carolina by collecting data from the NC Division of Water Resources (DWR) Monitoring Well Network (MWN). Spanning from the Great Smoky Mountains to the Outer Banks, the MWN consists of approximately 700 wells at more than 230 stations. These wells cover the state’s major aquifers, ranging in depth from less than 10 to more than 1,300 feet. While a typical Coastal Plain station features several wells screened in specific aquifers, stations in the Piedmont and Mountain regions generally consist of a single well within the basement rock/saprolite system. To ensure a true baseline, MWN stations are traditionally located where industrial, agricultural, or land-use influences are unlikely. This broad geographic and geologic coverage allows the GWRB to maintain a robust long-term program to characterize "background" groundwater quality across both deep and shallow systems and monitor shifts in these trends over time.
Results from the ambient groundwater quality monitoring project provide valuable data that help inform DWR and DEQ’s water quality management decisions. This information is used to set protection levels through water quality standards and to identify emerging problem areas as well as other areas requiring additional regulatory and non-regulatory actions. While the focus of this study was originally intended to identify potential agricultural influences on drinking water in the Coastal Plain, data from this project now supports multiple program areas such as nutrient management, coal ash management, groundwater as a source of surface water parameters of concern, and saltwater intrusion.
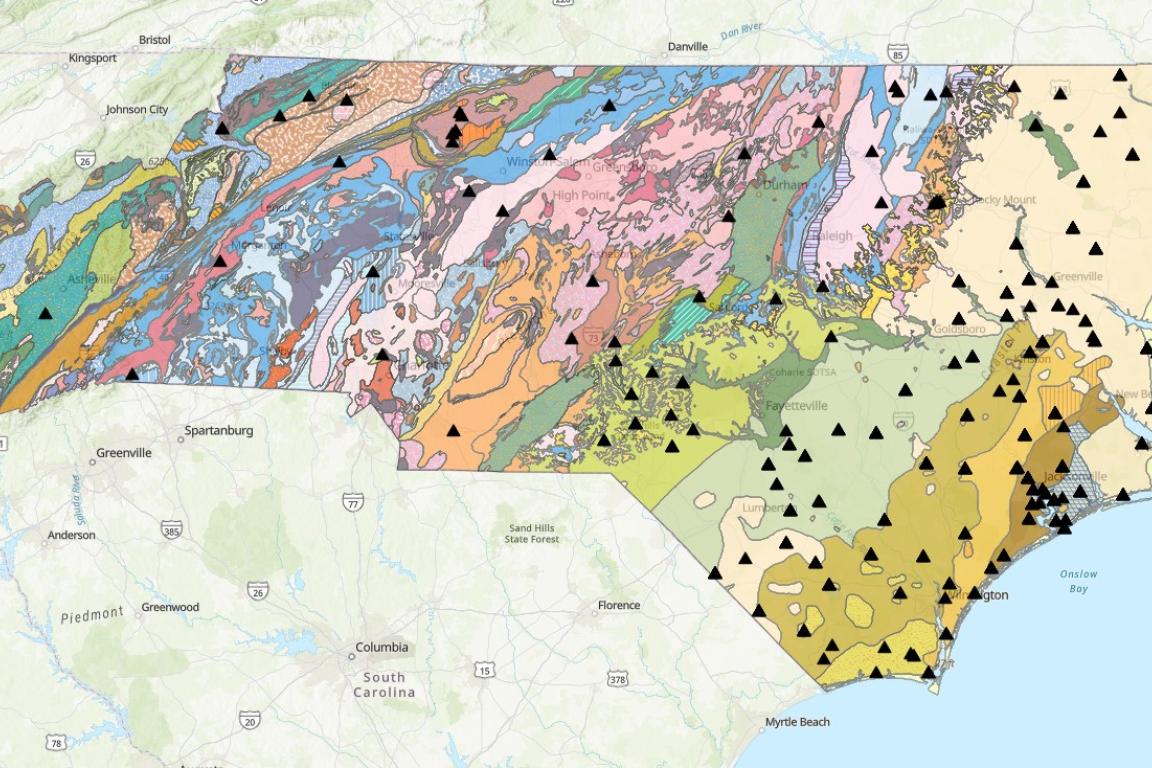
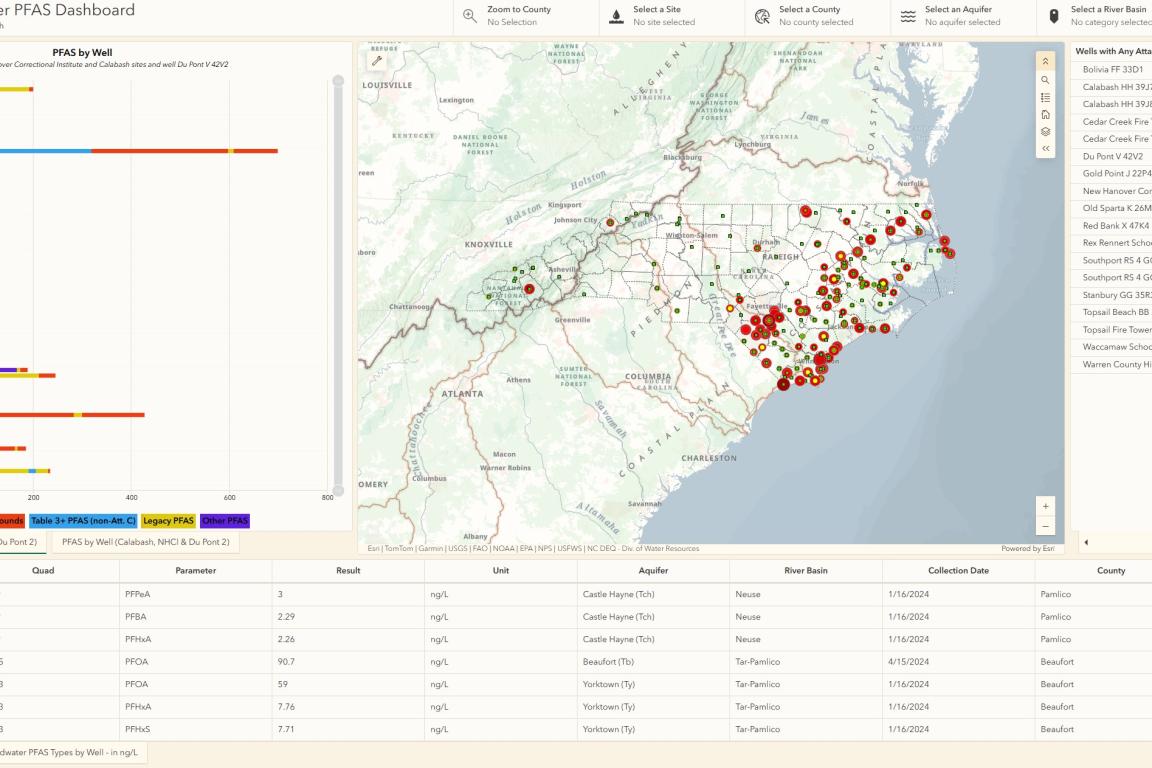
Explore More
Statewide Characterization - Establish a baseline of groundwater quality across North Carolina's distinct geologic environments, including the Coastal Plain aquifers.
Regulatory Compliance & Risk Assessment - Identify regions where groundwater quality deviates from NC 02L Standards to highlight areas of environmental concern.
Long-term Trend Monitoring - Maintain a recurring sampling schedule for the DWR Monitoring Well Network, testing surficial and confined aquifers every 1–5 years to detect long-term quality trends.
Data Accessibility - Ensure all GWRB groundwater data is accessible to the public via user-friendly mapping applications and downloadable formats.
- Field Parameters - Temperature, pH, Dissolved Oxygen, Specific Conductivity, Oxidation-Reduction Potential, Turbidity
- Major Ions - Calcium, Magnesium, Sodium, Potassium, Carbonate/Bicarbonate, Chloride, Sulfate, etc.
- Nutrients - Nitrate, Ammonia, Total Kjeldahl Nitrogen (TKN), Phosphorus, etc.
- Trace Metals - Arsenic, Manganese, Mercury, Selenium, etc.
- Volatile Organic Compounds (VOCs)
- Semi-volatile Organic Compounds (SVOCs)
- Pesticides
- Per- and Polyfluoroalkyl Substances (PFAS)
For additional information regarding the analytes measured and analysis methods used, please contact Andy Neal at andy.neal@deq.nc.gov
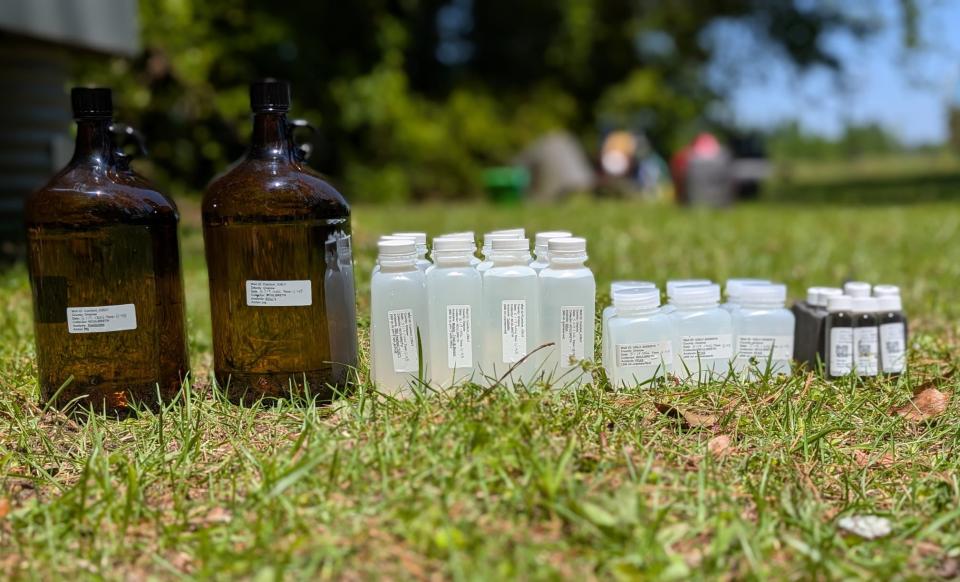
The NC-DWR Monitoring Well Network consists of 696 wells at 237 stations. The tables below summarize the well network as of July 7, 2026, by physiographic region, aquifer, and county. Please note that many monitoring well sites, particularly in the Coastal Plain, have multiple wells screened in different aquifers, which skews the total site count in that table.
| Physiographic Region | Wells | Sites |
|---|---|---|
| Piedmont | 39 | 36 |
| Mountains | 20 | 16 |
| Coastal Plain | 637 | 185 |
| Total | 696 | 237 |
| Aquifer | Wells | Sites |
|---|---|---|
| Basement Rock | 47 | 45 |
| Basement Saprolite | 12 | 11 |
| Beaufort | 23 | 22 |
| Black Creek | 85 | 69 |
| Castle Hayne | 104 | 63 |
| Hybrid | 1 | 1 |
| Lower Cape Fear | 35 | 33 |
| Lower Cretaceous | 5 | 5 |
| Lower Peedee | 1 | 1 |
| Not Determined Yet | 4 | 1 |
| Peedee | 68 | 54 |
| Surficial | 160 | 136 |
| Upper Black Creek | 12 | 12 |
| Upper Cape Fear | 79 | 67 |
| Upper Cape Fear CU | 1 | 1 |
| Upper Tertiary | 1 | 1 |
| Yorktown | 55 | 42 |
| County | Wells | Sites |
|---|---|---|
| Alleghany | 1 | 1 |
| Ashe | 1 | 1 |
| Beaufort | 49 | 14 |
| Bertie | 22 | 4 |
| Bladen | 24 | 7 |
| Brunswick | 28 | 12 |
| Buncombe | 3 | 1 |
| Burke | 1 | 1 |
| Carteret | 13 | 3 |
| Chatham | 1 | 1 |
| Cherokee | 2 | 2 |
| Chowan | 3 | 1 |
| Columbus | 20 | 4 |
| Craven | 28 | 7 |
| Cumberland | 8 | 3 |
| Currituck | 6 | 3 |
| Dare | 26 | 10 |
| Davidson | 1 | 1 |
| Davie | 1 | 1 |
| Duplin | 23 | 4 |
| Edgecombe | 3 | 1 |
| Franklin | 2 | 2 |
| Gates | 6 | 1 |
| Granville | 2 | 2 |
| Greene | 8 | 2 |
| Guilford | 2 | 2 |
| Halifax | 4 | 2 |
| Haywood | 2 | 2 |
| Hertford | 6 | 3 |
| Hoke | 2 | 2 |
| Hyde | 15 | 4 |
| Iredell | 1 | 1 |
| Jackson | 2 | 2 |
| Johnston | 2 | 2 |
| Jones | 14 | 3 |
| Lenoir | 23 | 7 |
| Martin | 14 | 2 |
| Mecklenburg | 1 | 1 |
| Montgomery | 1 | 1 |
| Moore | 11 | 8 |
| Nash | 4 | 4 |
| New Hanover | 15 | 6 |
| Northampton | 2 | 2 |
| Onslow | 76 | 18 |
| Orange | 2 | 2 |
| Pamlico | 24 | 4 |
| Pasquotank | 12 | 5 |
| Pender | 15 | 5 |
| Perquimans | 4 | 2 |
| Pitt | 41 | 11 |
| Polk | 1 | 1 |
| Randolph | 1 | 1 |
| Richmond | 6 | 2 |
| Robeson | 28 | 8 |
| Rockingham | 4 | 1 |
| Sampson | 25 | 6 |
| Scotland | 3 | 1 |
| Surry | 3 | 3 |
| Swain | 5 | 5 |
| Tyrrell | 3 | 1 |
| Union | 1 | 1 |
| Wake | 1 | 1 |
| Warren | 3 | 3 |
| Washington | 14 | 4 |
| Watauga | 3 | 1 |
| Wayne | 10 | 3 |
| Wilkes | 2 | 2 |
| Wilson | 4 | 1 |
| Yadkin | 2 | 2 |
The GWRB has established collaborations with researchers and educators from several universities, including NC State University, Duke University, East Carolina University, Western Carolina University, UNC-Wilmington, UNC-Asheville, and Virginia Tech. Collaborations may consist of the GWRB providing groundwater samples and relevant background data, while the participating collaborator provides sample bottles, lab analysis, and subsequent data interpretation; however, we welcome inquiries regarding other collaborative structures.
We encourage interested parties to contact the GWRB at andy.neal@deq.nc.gov to discuss potential collaboration opportunities.
The Ambient Groundwater Monitoring Project has identified naturally occurring contaminants across North Carolina, some of which exceed NC 2L Drinking Water Standards. The table below summarizes naturally occurring contaminants detected in at least 5% of wells in the DWR MWN sampled after 2015 (As of May 6, 2026). Iron and manganese are the most frequent and are predominantly found in the Coastal Plain. Although less common across the DWR MWN, radon and uranium NC 2L exceedances occur within granitic and metamorphic terrains of the Piedmont and Blue Ridge regions.
| Parameter | NC 2L Standard | Number of Wells Sampled | Number of Wells Exceeding NC2L | Percent of Wells Exceeding NC2L |
|---|---|---|---|---|
| Iron (Dissolved) | 300 μg/L | 458 | 230 | 50 |
| Manganese (Dissolved) | 50 μg/L | 458 | 157 | 34 |
| Boron (Dissolved) | 700 μg/L | 453 | 109 | 24 |
| Chloride | 250 mg/L | 460 | 68 | 15 |
| Fluoride | 2 mg/L | 460 | 27 | 6 |
| Sulfate | 250 mg/L | 460 | 29 | 6 |
| NH3-N | 1.5 mg/L | 460 | 25 | 5 |
PFAS continues to be a focus of the Ambient Groundwater Monitoring Project and has been incorporated into the routine sample suite. As of July 7, 2026, PFAS has been detected in 27% of the MWN with PFBA, PFOA, PFOS, and PFPeA being the most commonly detected analytes. Learn more about the Water Quality PFAS Standards for North Carolina.
Check out the North Carolina Division of Water Resources Groundwater Resources Branch Monitoring Well Network Fiscal Year 2025 Annual Report.
1940s – The U.S. Geological Survey (USGS) initiates the first formal groundwater quality monitoring program in North Carolina.
1960s – North Carolina establishes regional field offices and installs monitoring wells to study groundwater quality and the impacts of significant withdrawals, primarily focusing on metals and major anions.
1970s – A comprehensive program is implemented to inventory natural groundwater quality and pollution sources. Two distinct networks are created to track both impacted and baseline (unimpacted) groundwater.
1980s – The formal Baseline Water Quality Network is established with ~380 wells across six hydrogeologic units. Analysis expands to include organic parameters like pesticides and volatiles.
1990s – 2010s – Large-scale studies commence, including the Piedmont-Mountains Resource Evaluation Program (REP), which investigated crystalline rock hydrogeologic conditions in various Piedmont and Mountain settings and the Southern Coast Plain Study, which targeted specific regional aquifers and nutrients. See Archive & Historic Project Reports section below for report.
2010 – 2012 – The Isolated Wetlands Study details findings from a long-term groundwater quality monitoring and aquifer testing across southeastern North Carolina and northeastern South Carolina. See Archive & Historic Project Reports section below for report.
2015 – A renewed initiative to sample all Monitoring Well Network wells begins; coverage has since expanded to 64 counties to establish a modern statewide baseline of groundwater quality.
2019 – Present – Monitoring shifts toward emerging contaminants, specifically PFAS. New mapping and visualization tools are deployed to analyze the occurrence and distribution of these substances across North Carolina.
Please Note: The documents below are historical records maintained for reference purposes. They do not reflect current agency standards and may not be fully screen-reader accessible. To request these files in an alternative format, please contact the Groundwater Resources Branch.
Check out the Southern Coastal Plain Study Report. - Archived historical document, may not be fully accessible
Check out the Isolated Wetlands Study Report. - Archived historical document, may not be fully accessible
This page was last modified on 08/25/2026