
DEQ's Division of Air Quality produces a statewide inventory of greenhouse gas (GHG) emissions that represents North Carolina’s “carbon footprint.” The 2026 update to the greenhouse gas inventory provides a high-level perspective of greenhouse gas emissions resulting from human activity and contains a detailed accounting of greenhouse gases emitted or removed by key source categories from 1990 through 2022. The update also projects North Carolina’s greenhouse gas emissions from 2023 to 2050 based on forecast changes in fuel use, population, historical trends and other factors.
Key takeaways in the 2026 inventory:
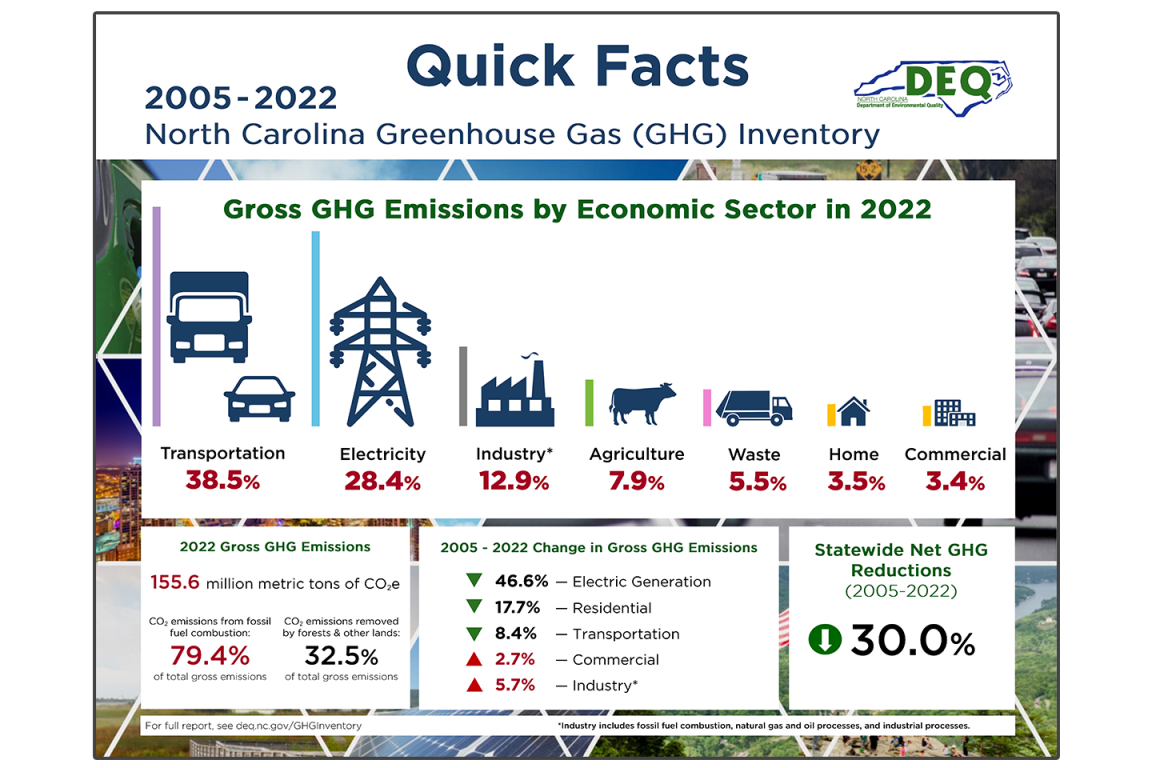
- Between 2005 and 2022, North Carolina reduced gross greenhouse gas emissions by approximately 21% and net emissions (which account for all carbon sequestered by natural lands) by 30%. Emissions fell even as North Carolina's population grew 23% and real Gross State Product increased 38% during the same time.
- Net emissions are projected to increase 7% between 2022-2030 before beginning to drop again through 2050. The increase largely is driven by new forecasts from Duke Energy showing an increase in burning natural gas and coal to meet growing electricity demand.
- The largest contributor to the state’s carbon footprint continues to be the transportation sector, which in 2022 accounted for 39% of the state’s gross emissions.
- Emissions from the electricity generation and use sector are nearly half of what they were in 2005 and represent the largest emissions decline in the inventory, as more of our power now comes from lower-emitting sources, including renewable energy.
- By 2050, North Carolina is projected to see a 48% and 64% decrease in gross and net GHG emissions, respectively, relative to 2005 emissions.
- Forests, natural lands and agricultural lands sequestered an estimated 32% of the state’s gross emissions in 2022.
The inventory can be used by environmental planners and energy policymakers in our State to understand past, current, and expected future GHG emissions in North Carolina. It can also be used as a baseline to evaluate and develop greenhouse gas mitigation options for our State and predict their effect on reducing emissions in future years.
Additional Information
The North Carolina GHG inventory estimates emissions of the primary anthropogenic greenhouse gas pollutants listed below.
- Carbon dioxide (CO2)
- Methane (CH4)
- Nitrous oxide (N2O)
- Hydrofluorocarbons (HFCs)
- Perfluorocarbons (PFCs)
- Nitrogen trifluoride (NF3)
- Sulfur hexafluoride (SF6)
Emission Activities by Sector
| Emission Sector | Emission Activity |
|---|---|
| Electricity Generation & Use | Fossil fuel combustion from coal, natural gas, and petroleum products, and imported electricity use |
| Residential (Home), Commercial, and Industrial Combustion | Stationary sources which combust coal, natural gas, petroleum products, and wood |
| Transportation | Emissions from gasoline highway, non-highway, diesel highway, and alternative fuel vehicles |
| Agriculture | Emissions from enteric fermentation, manure management, agricultural residue burning, and agricultural soils management |
| Waste Management | Emissions from municipal solid waste and wastewater operations |
| Industrial Processes | Emissions from industrial operations including:
|
| Natural Gas and Oil Systems | Fugitive emissions from natural gas transmission and distribution |
| Net Carbon Sinks |
|
2024 Greenhouse Gas Inventory
2024 Report
2024 Executive Summary
2024 Quick Facts
2022 Greenhouse Gas Inventory
2022 Report
2022 Executive Summary
2022 Quick Facts
2019 Greenhouse Gas Inventory
For more information:
Email Andy Bollman
Division of Air Quality
For media inquiries:
Email Shawn Taylor
919-707-8446
Division of Air Quality Public Information Officer