
DEQ study: PFAS in wastewater and biosolids
Overview
Starting in 2023, DEQ conducted a pilot study to understand PFAS concentrations in the following sources:
wastewater flowing into treatment plants, which is known as influent;
in the treated solid material removed from the plants, which is known as biosolids;
and in the treated wastewater, known as effluent, that is discharged to rivers, creeks and streams.
Soil samples from fields that received applications of biosolids were also tested for PFAS. An overview of the study, including background information and a summary of the results, is available online: presentation slides. The analytical results are also available for download: analytical results.
DEQ appreciates the support and assistance provided by permitted facilities, landowners, staff and others who made this study possible.
There are currently no federal or North Carolina state regulatory requirements for PFAS in biosolids. The U.S. Environmental Protection Agency and multiple states have conducted studies to evaluate the occurrence of PFAS in biosolids and their potential impacts. This North Carolina study adds to the knowledge base. The results of this study represent early findings intended to inform future study design and identify opportunities for more data collection and analysis. A detailed investigation on the fate and movement of these chemicals in the environment was beyond the scope of this project.
Background
Per- and polyfluoroalkyl substances (PFAS) are a large and diverse group of manufactured chemicals. Due to their unique properties, PFAS have been used globally for decades in a wide range of consumer and industrial products. Many PFAS compounds are very stable and do not break down readily. Because of their persistence and widespread use, PFAS are found throughout the environment. The U.S. Environmental Protection Agency provides resources to help explain what is currently known about human health and environmental risks of PFAS, including some common sources of PFAS in consumer products and industrial processes.
DEQ has been working to identify and address PFAS issues across the state. More information is available online: Understanding PFAS
Biosolids are the nutrient-rich organic materials that remain after wastewater has gone through treatment at a municipal or industrial facility. During the treatment process, solids are separated from the water and then further stabilized, typically through digestion, dewatering, or drying to reduce pathogens and odors. Biosolids can be beneficially reused through land application to improve soil health or as fertilizer, or managed through other disposal or treatment pathways such as landfilling or incineration.
Land application of biosolids has long been considered a sustainable approach to recycling communities’ waste material. According to the U.S. EPA, the land application of biosolids can improve soil health and condition and provide nutrients to support plant growth, and it also generates lower greenhouse gas emissions compared with other management strategies for biosolids.
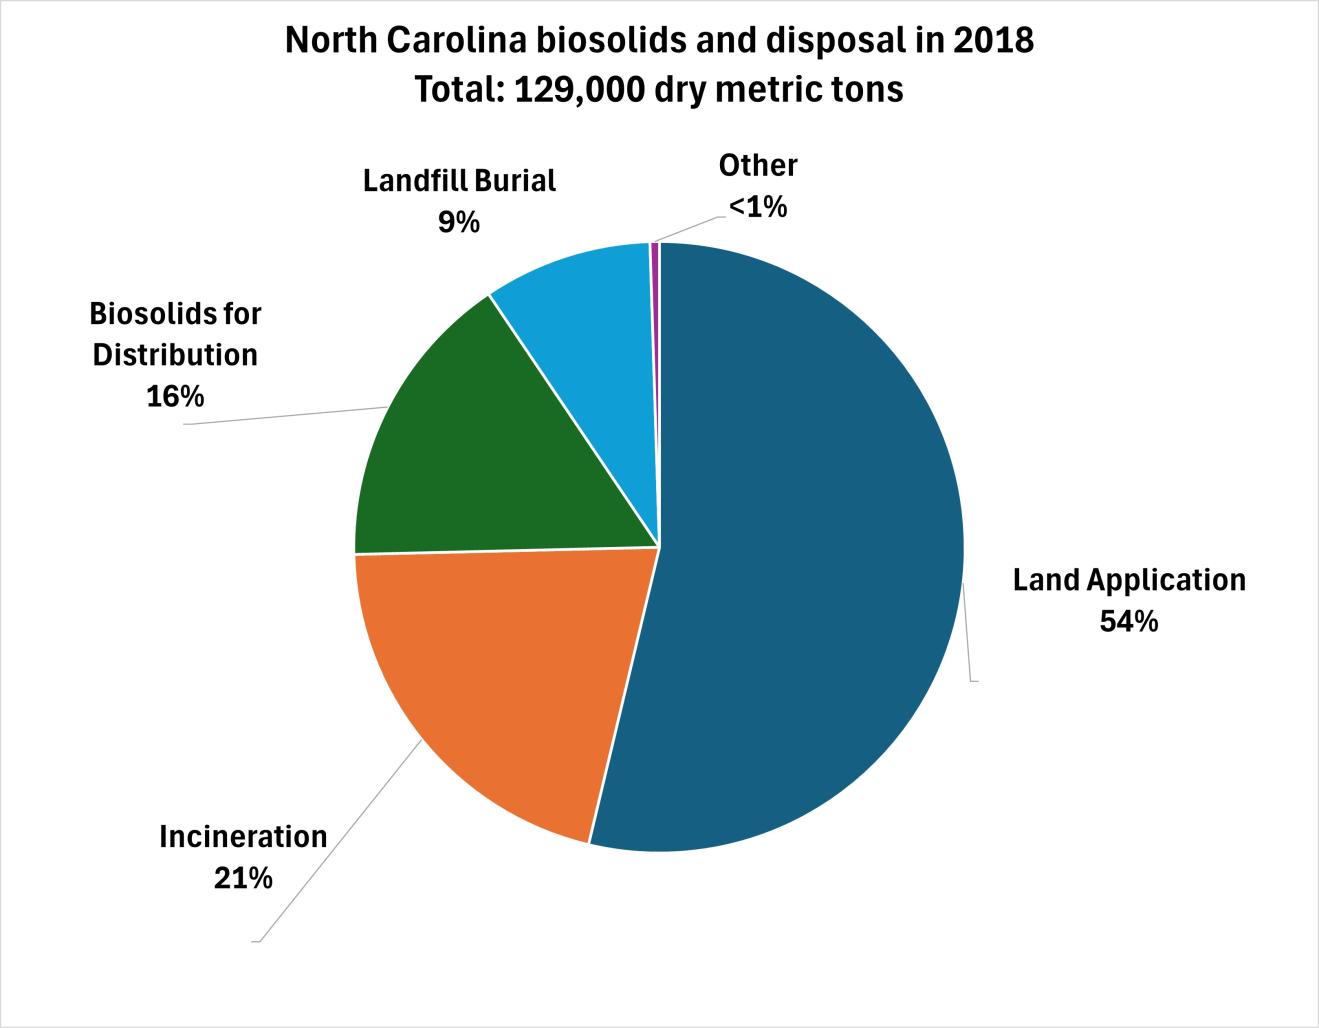
Data from the National Biosolids Data Project (2018) are shown below. The data indicate most biosolids in North Carolina went to land application, followed by incineration, distribution to the public and landfilling.
Federal (40 CFR Part 257 and 40 CFR Part 503) and North Carolina (15A NCAC 02T) regulations govern the use of residuals including biosolids, and specify restrictions such as treatment levels, appropriate uses, application limits and minimum setbacks. In the 15A NCAC 02T rules, "residuals" are defined as any solid, semi-solid or liquid waste, other than effluent or agricultural products and processing residue, generated from a permitted wastewater treatment facility, water supply treatment facility or air pollution control facility. In North Carolina, state non-discharge permits are required for the distribution and land application of biosolids. Application rates are based on the intended crop nutrient and metal uptake along with other factors intended to protect human and environmental health. State and federal mandatory annual reporting is required for all residual distribution and land application programs.
Residential, commercial and industrial wastewater is collected and treated at municipally operated wastewater treatment facilities or publicly owned treatment facilities, while some industries operate their own onsite treatment systems. Federal and state regulations govern the quality of wastewater discharged to surface waters to ensure the wastewater discharge does not harm people or the environment. Because raw, untreated wastewater can contain a variety of pollutants, it must be properly treated before being released back into the environment or reused.
DEQ oversees both municipally operated treatment plants and industrial facilities that discharge treated wastewater directly to waterways within the state, while municipalities regulate industrial users connected to the public sewer system through what is known as pretreatment programs. Industries that discharge wastewater to publicly owned treatment facilities, and that generate significant volumes of wastewater and/or discharge wastewater that contains certain pollutants, are identified as significant industrial users (SIUs) by the publicly-owned treatment facilities.
Wastewater treatment plants do not produce PFAS compounds. Facilities such as municipal WWTPs (which are also known as publicly owned treatment works, or POTWs) are considered "passive receivers" because they receive PFAS from industrial, commercial and residential dischargers. Similarly, an industrial facility could have background PFAS entering via contaminated source water. Some PFAS chemicals entering a wastewater treatment plant can transform into more persistent PFAS during the treatment process. These chemicals, known as “PFAS precursors,” may not be detected with standard analytical techniques even when they are present.
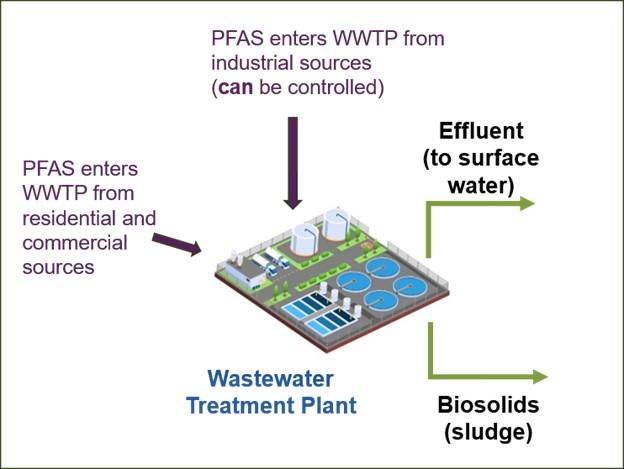
During the treatment process, the liquid influent, or wastewater flowing into a plant, is treated and separated into liquid effluent and solids (Figure 1). The solids that are separated are a semisolid, nutrient-rich material known as biosolids or sewage sludge. PFAS are not removed during the wastewater treatment process, as the process is designed to remove conventional biological pollutants. Since PFAS are present in wastewater, and PFAS compounds have diverse properties not targeted during the treatment process, both the liquid effluent and biosolids will contain PFAS. The PFAS compounds present in the treated wastewater are discharged to surface water. Biosolids that are generated are managed either through land application, landfilling or incineration. Since conventional treatment methods are not effective for PFAS removal, it is critical to implement source reduction strategies to reduce the amount of PFAS entering treatment plants.
Study design
In 2023, DEQ conducted a pilot study to understand PFAS concentrations in the influent, biosolids and effluent of select wastewater treatment plants. Because biosolids can be used on agricultural fields to improve soil health and provide plant nutrients, DEQ also collected and tested soil samples from fields with a history of biosolids application. An overview of the study, including background information and a summary of the results, is available online: presentation slides. Analytical results are also available for each facility sampled: analytical results spreadsheet. This was a preliminary study designed to gather basic information, inform future study design and identify opportunities for more comprehensive data collection and analysis.
Wastewater treatment plants
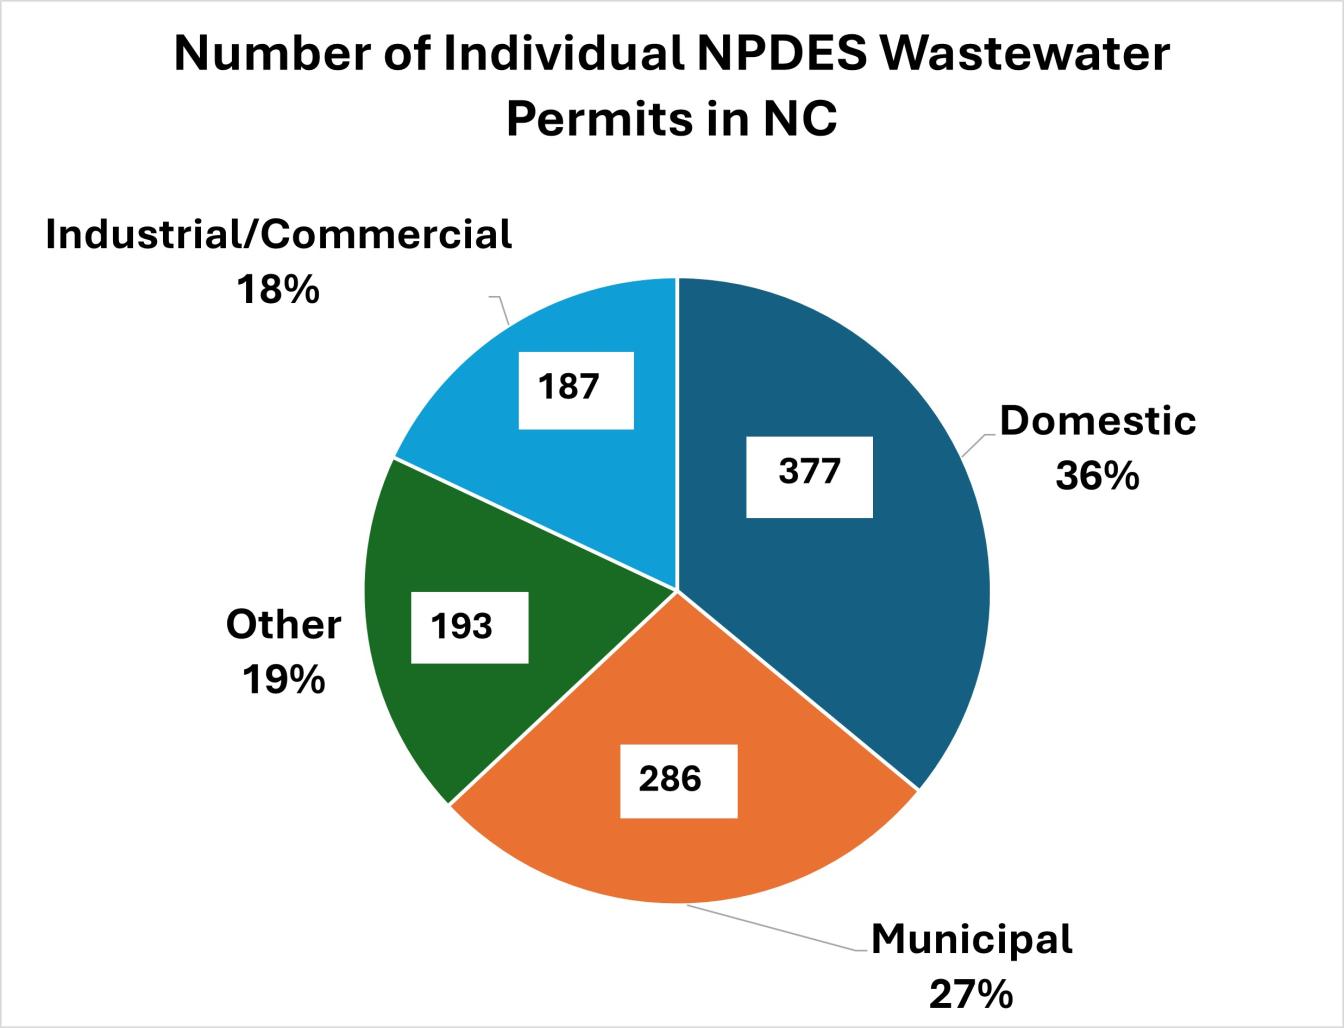
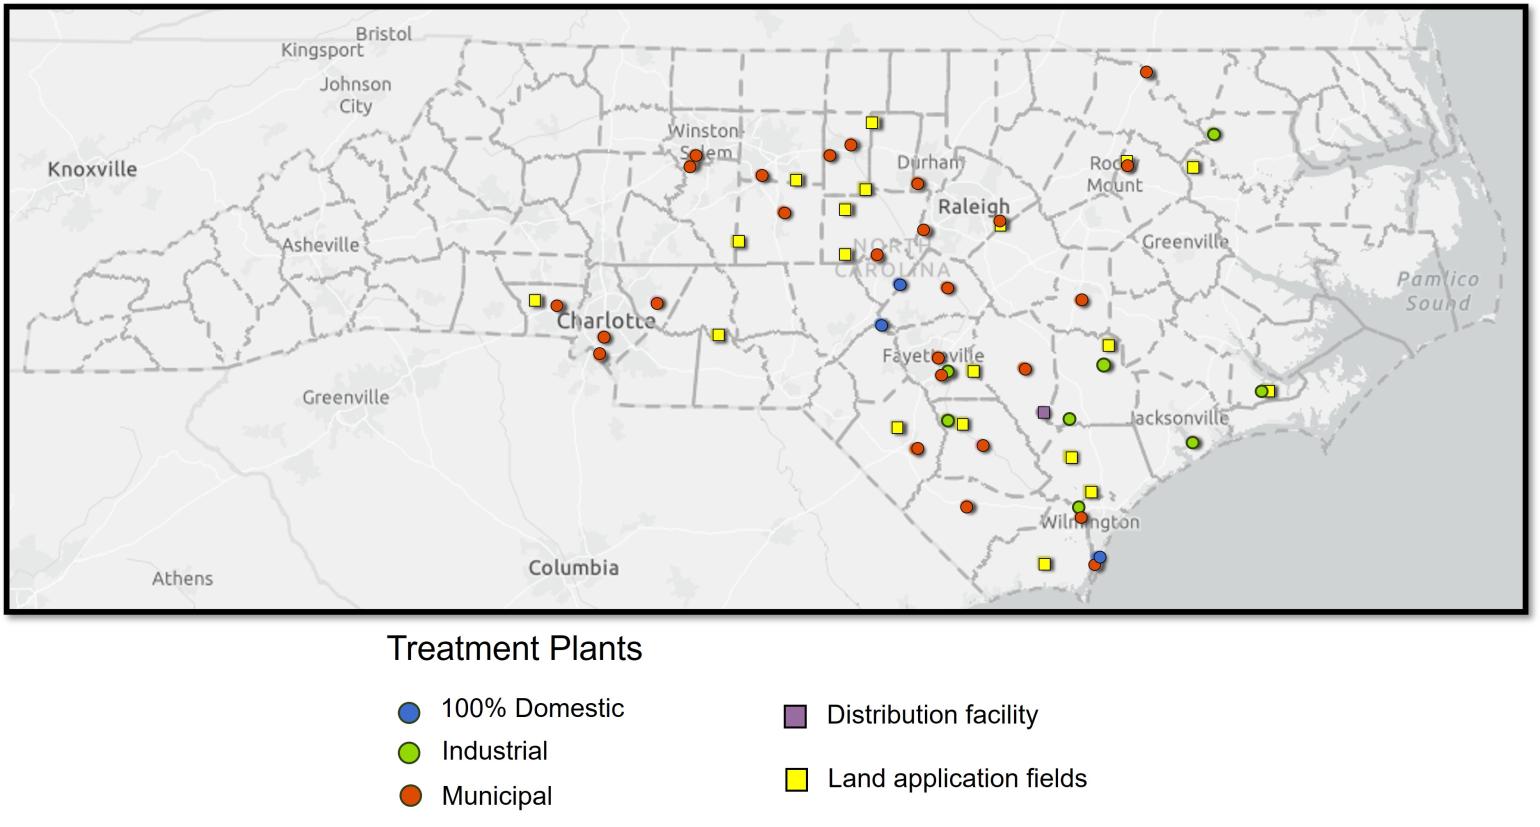
Thirty-seven wastewater treatment plants were included in this study located in 27 counties and eight river basins. These facilities represent a small subset of the 1,043 facilities permitted through the National Pollutant Discharge Elimination System (NPDES) program in North Carolina.
The facilities were selected for the study based on size (highest permitted flow); the nature of the significant industrial users (SIUs) sending wastewater for treatment at publicly-owned treatment facilities; a review of existing PFAS data; and three operating characteristics. The facilities selected include:
- Three (3) treatment plants that receive 100% domestic (residential and some commercial facilities) wastewater with no industrial contributions
- Eight (8) industrial wastewater treatment plants that primarily treat industrial flows, and
- Twenty-six (26) municipal wastewater treatment plants that receive a combination of wastewater from significant industrial users, commercial establishments, and residential sources.
For the treatment plants, either one or two rounds of grab samples were collected from the influent, or wastewater entering the plant for treatment, from the biosolids and from the treated wastewater, or effluent. Samples were collected between March and September 2023.
Land application fields
DEQ staff collected soil samples from 19 land application fields that receive biosolids from wastewater treatment plants, operated under 17 different non-discharge permits. These fields were selected based on their history of biosolids application and were categorized as receiving biosolids from predominantly industrial (three fields), municipal (13 fields), or mixed (three fields) sources. Soil samples were collected from March to June 2023. Contributions from other potential sources of PFAS contamination such as background levels in rainfall, atmospheric deposition, or pesticide applications were not evaluated for this preliminary study.
One sample of finished compost that included biosolid source material was also collected from a distribution facility.
Analytical method and laboratory
All samples collected for this study were sent to the same laboratory in Charleston, South Carolina, where they were analyzed for the presence of PFAS using a modified version of EPA Method 537.1. This method was selected because it includes an expanded suite of PFAS (57 total). This method also includes all PFAS listed in attachment C of the consent order with Chemours. Analytical results are available in a spreadsheet format for influent, effluent, biosolids and soil samples. Details such as analytical results, reporting limits, quality control measures and the laboratory narrative are included in the laboratory reports for this study. The spreadsheet of data includes links to the public document folders where these laboratory reports can be found for each permitted facility. When comparing data from this study with other sources, please note the use of different laboratories and analytical methods (such as versions of EPA Method 1633 versus 537.1) will have different analyte lists and reporting limits. A direct comparison to data gathered using a different methodology may not be appropriate.
Sampling protocol
DEQ Division of Water Resources developed an internal guidance document for this study to assist staff with the sampling efforts. The guidance document includes information on sampling supplies used as well as standard operating procedures for sample collection and submission to the laboratory.
Study Results
PFOA, PFOS and Total PFAS
The data analysis for this study focused on two PFAS compounds that are the most well-studied — PFOA and PFOS — as well as Total PFAS. For this study, Total PFAS represents the sum of all PFAS compounds quantified in a given sample using a modified EPA Method 537.1. Total PFAS is not a standardized metric. The value for a given sample will differ depending upon the analytical method used and reporting limits. However, Total PFAS does provide a useful way to broadly compare overall levels among similar samples that have been analyzed in the same way. The Total PFAS value does not include the multitude of PFAS compounds that may be present in a sample, but are not detected by the selected analytical method.
Results for influent, effluent, biosolids, and soils are summarized below. More information is available in the presentation slides.
Range of influent and effluent PFAS concentrations by treatment facility type
| Type | Number included in study | PFOS influent (ppt) | PFOS effluent (ppt) | PFOA influent (ppt) | PFOA effluent (ppt) |
|---|---|---|---|---|---|
| 100% domestic | 3 | 4 - 14 | 3 - 16 | 3 - 8 | 8 - 28 |
| municipal | 26 | 3 - 38 | 2 - 39 | 2 - 88 | 2 - 95 |
| industrial | 8 | 3 - 121 | 2 - 86 | 3 - 51 | 1 - 50 |
Note: 1,000 ppt = 1 ppb = ng/g
| Type | Number included in study | Total PFAS influent (ppt) | Total PFAS effluent (ppt) |
|---|---|---|---|
| 100% domestic | 3 | 61 - 112 (average = 80) | 94 - 217 (average = 192) |
| municipal | 26 | 10 - 4124 (average = 380) | 90 - 7828 (average = 533) |
| industrial | 8 | 5 - 508 (average = 276) | 3 - 1419 (average = 663) |
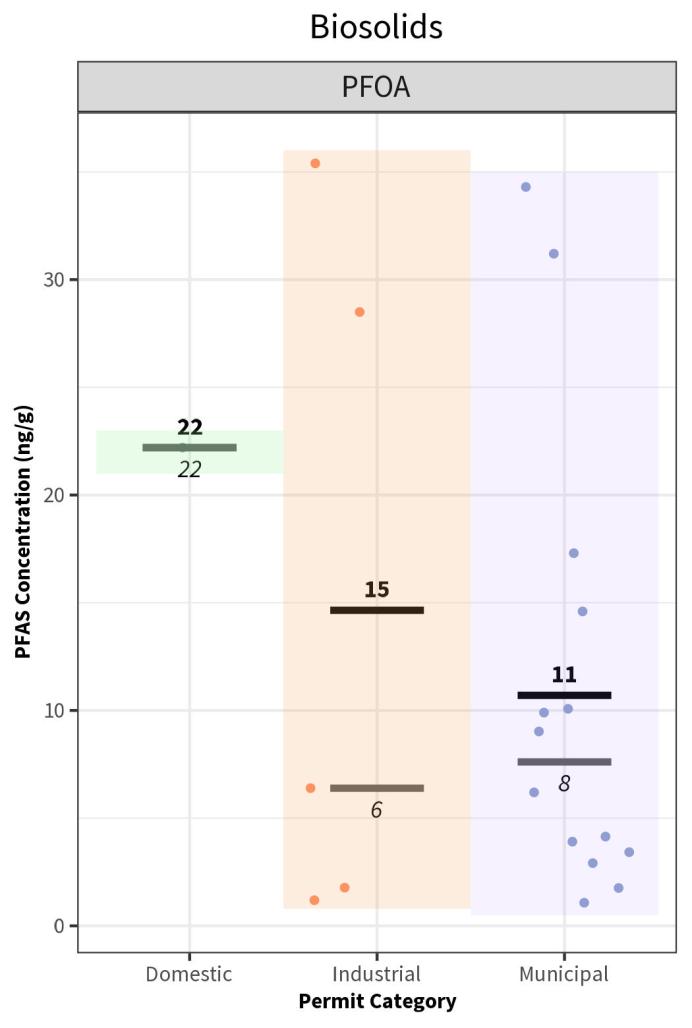
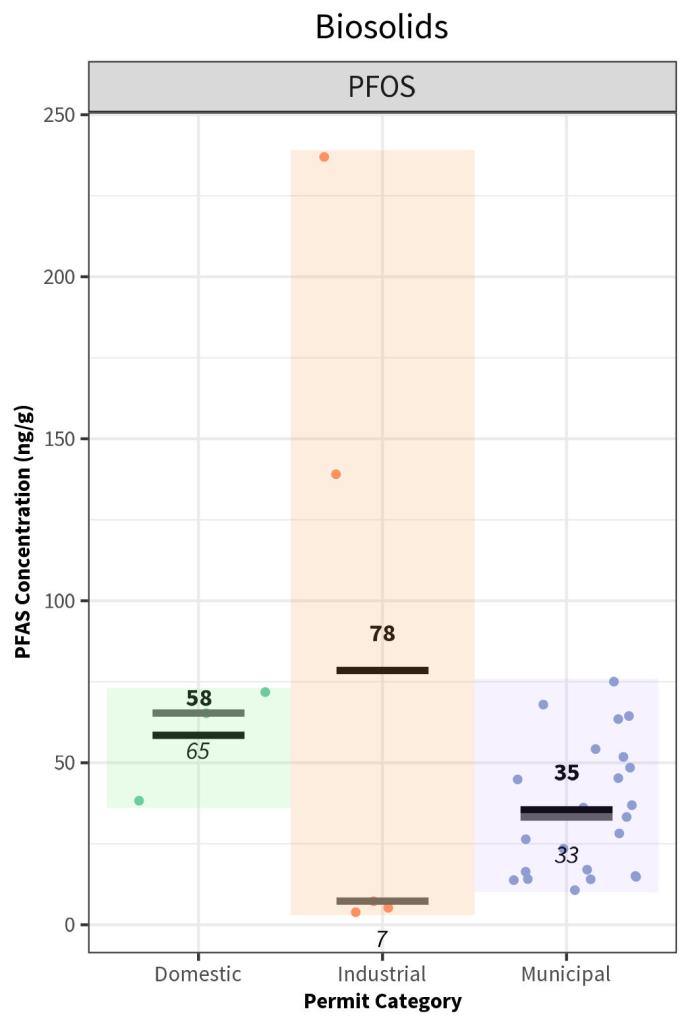
PFOA, PFOS and Total PFAS levels in biosolids
Individual dots represent specific facilities. The black line and bold number (shown above the bars) represent the average for the category, the gray line and italicized number (shown below the bars) represent the median. Samples with non-detects are not included on the respective bar or in the category statistics. Note: 1000 ppt = 1 ppb = ng/g.
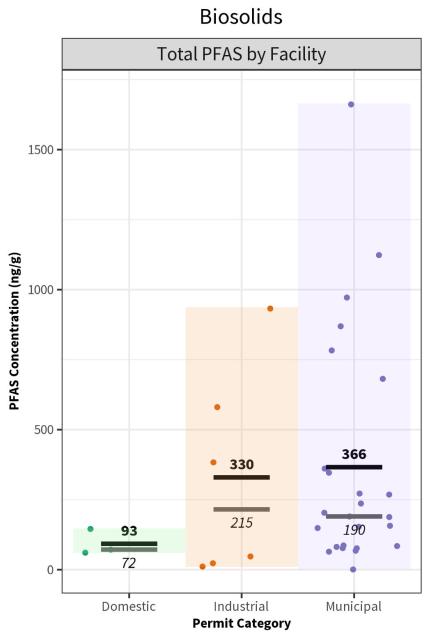
Note the different vertical scale for Total PFAS. Individual dots represent specific facilities. The black line and bold number (shown above the bars) represent the average for the category, the gray line and italicized number (shown below the bars) represent the median. Samples with non-detects are not included on the respective bar or in the category statistics. Note: 1000 ppt = 1 ppb = ng/g.
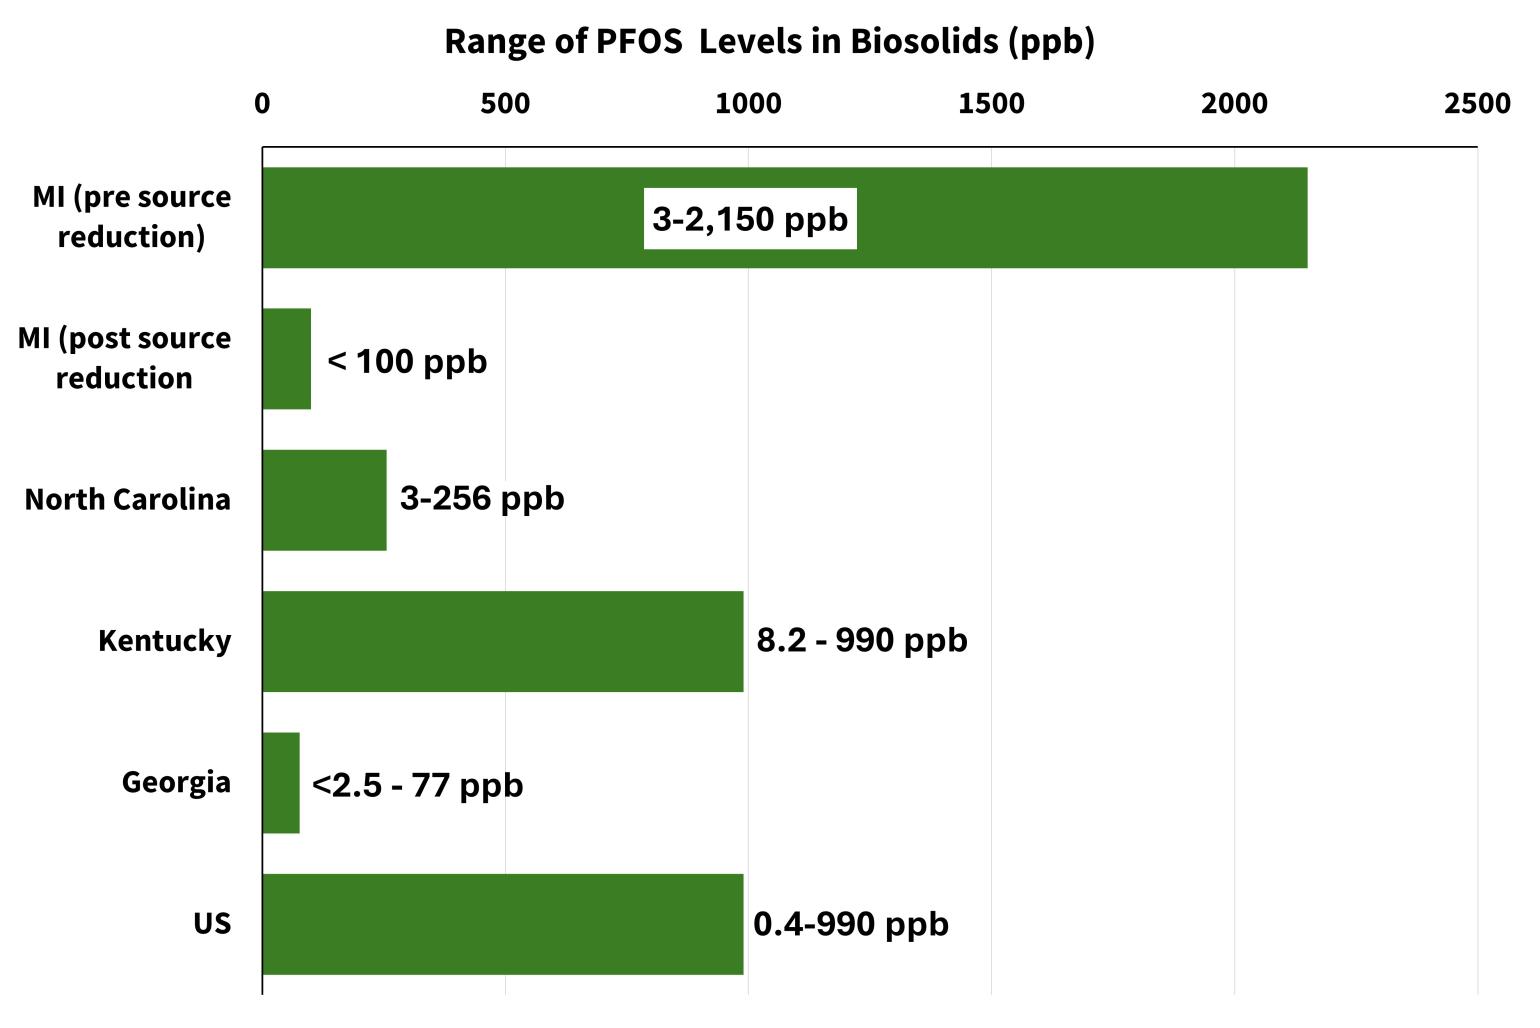
PFOS in biosolids: Comparison with selected states
At least three states (Michigan, New York and Wisconsin) have limits for PFOA and PFOS levels in biosolids intended for land application, and at least nine states have implemented monitoring requirements for PFAS in biosolids.
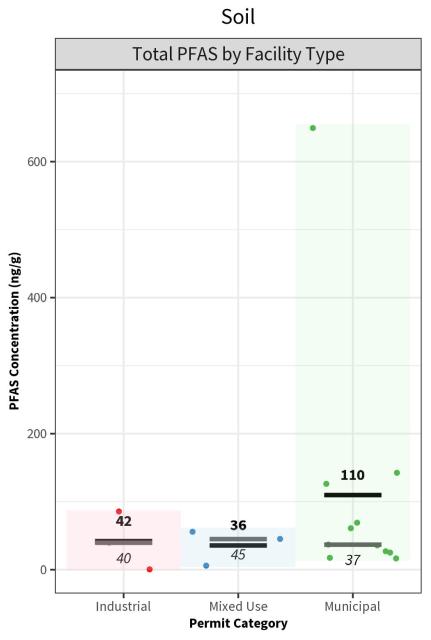
PFOA, PFOS and Total PFAS in soils from land application fields
Individual dots represent specific fields. The black line and bold number (shown above the bars) represent the average for the category, the gray line and italicized number (shown below the bars) represent the median. Samples with non-detects are not included on the respective bar or in the category statistics. Note: 1000 ppt = 1 ppb = ng/g.
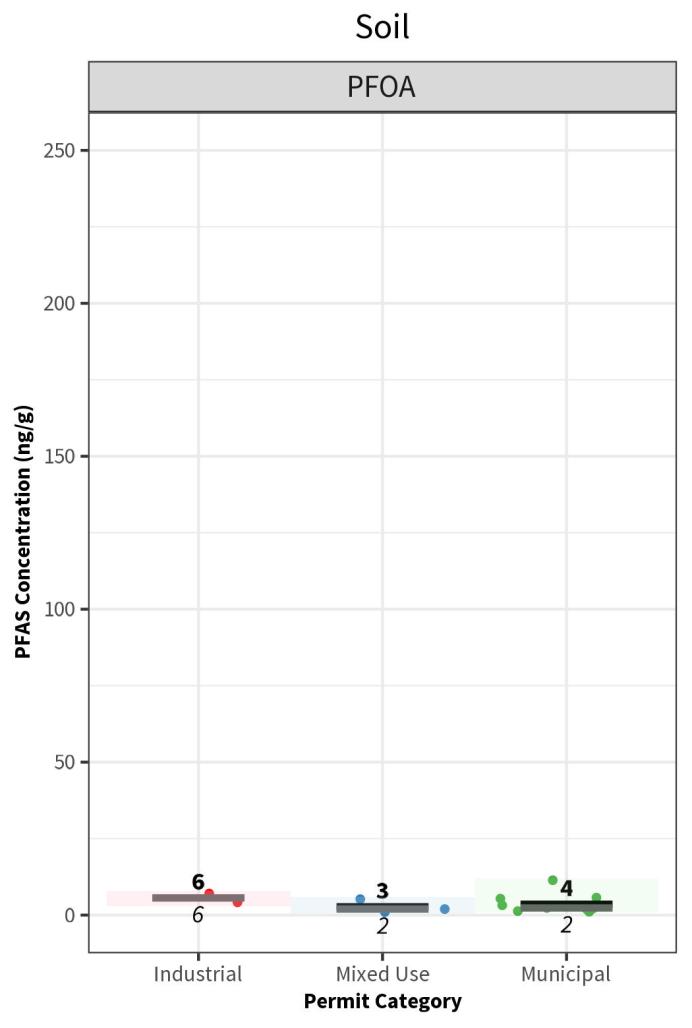
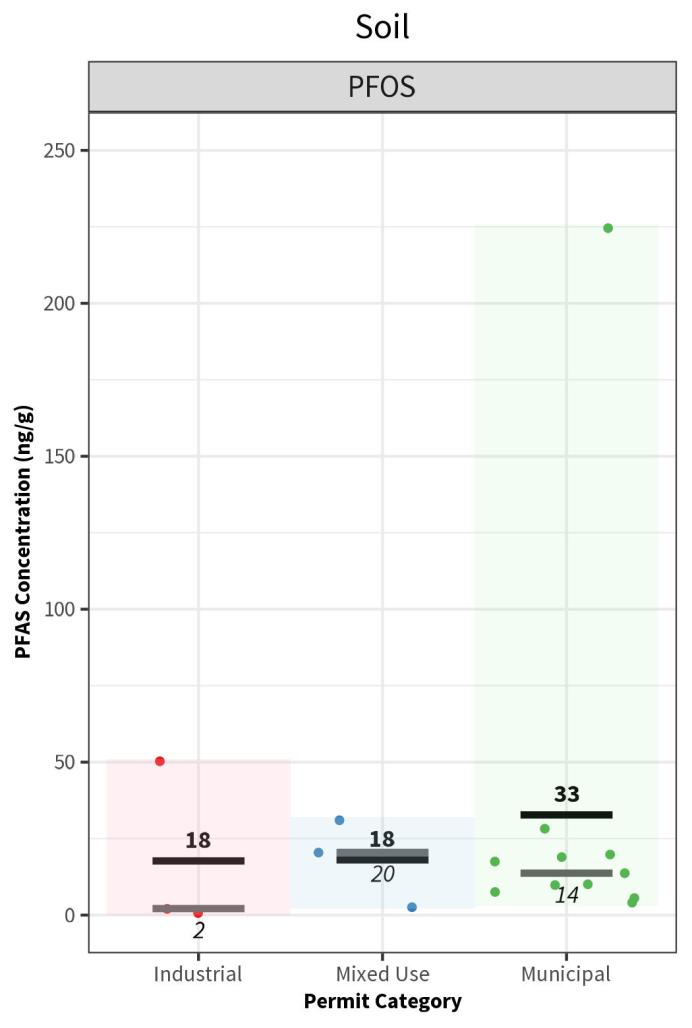
Note the different vertical scale for Total PFAS. Individual dots represent specific fields. The black line and bold number (shown above the bars) represent the average for the category, the gray line and italicized number (shown below the bars) represent the median. Samples with non-detects are not included on the respective bar or in the category statistics. Note: 1000 ppt = 1 ppb = ng/g.
Summary findings
- PFAS were detected in all facilities sampled and across wastewater, biosolids, soil and compost samples.
- PFAS concentrations in wastewater influent and effluent varied widely, particularly in municipal systems.
- Average Total PFAS concentrations in influent and effluent for the three domestic wastewater plants were lower than average levels found in municipal and industrial facilities.
- The majority of wastewater treatment plants had influent and effluent detections above 4 ppt parts per trillion (ppt) for PFOA and/or PFOS. The 4 ppt represents the federal maximum contaminant level in drinking water for these two compounds, but at this time there are no federal or North Carolina state surface water quality criteria or standards for PFAS.
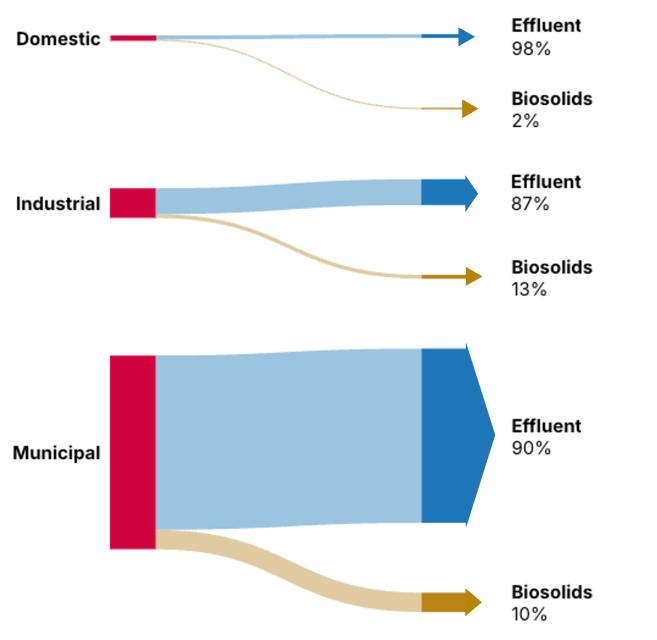
- Based on the data, it is estimated that 87-98% of the Total PFAS entering wastewater treatment plants on an annual basis is discharged to surface water in effluent, and 2-13% of the Total PFAS entering wastewater treatment plants in this study is removed with biosolids. This is primarily due to the large amount of wastewater effluent produced compared with the amount of biosolids generated.
Estimated Mass of PFAS Leaving WWTPs Sampled in NC
- PFOS was detected in biosolids with concentrations consistent with levels found in other states. North Carolina's results from this study ranged from 3 to 256 parts per billion (ppb), while the overall range for the United States is 0.4 to 990 ppb (US EPA, 2025).
- PFOS was detected in all the soil samples collected from the land application fields.
Next steps
DEQ will continue to work with stakeholders to identify PFAS sources in wastewater discharges, promote strategies to reduce PFAS in wastewater from permitted industrial dischargers, respond to concerns about PFAS, and support informed regulatory decision-making.
DEQ is collaborating with academic experts and local utilities to investigate potential impacts of land application of biosolids on nearby private drinking water wells; these efforts will advance the scientific understanding of PFAS exposure associated with land application of biosolids.
Additional resources
ECOS - PFAS in Biosolids: Review of State Efforts and Opportunities for Action (2023)
Michigan EGLE - PFAS in Biosolids
PennState Extension - An Overview of PFAS and Land-Applied Biosolids
EPA Draft Sewage Sludge Risk Assessment for PFOA and PFOS (2025)
US EPA Draft Sewage Sludge Risk Assessment for PFOA and PFOS: Information for Farmers