
North Carolinians are breathing the cleanest air they have in decades. Due to hard work and sound environmental policy, emissions of harmful air pollution like fine particles and nitrogen oxides continue to trend downward, even as our state's population and economy grow.
The proof is in the air: Data from DEQ's ambient monitoring network show near-record lows of concentrations of criteria air pollutants regulated under the clean air act. Our state has been in compliance with every federal health-based air quality standard since 2015.
Report Highlights
Emissions continue to fall
Overall, North Carolina continues to show a general trend toward less air pollution emissions. Over the past three decades, state leaders, regulatory agencies, electric utilities, industry, and the public have significantly addressed air quality concerns.
From 1993-2022, combined emissions of federally designated Hazardous Air Pollutants and state-designated Toxic Air Pollutants have fallen by more than 108 million pounds, an 82% drop.
decline in SO2 emissions
from 1990-2022
decline in CO emissions
from 1990-2022
decline in VOC emissions
from 1990-2022
decline in HAP & TAP emissions
from 1993-2022
decline in NOx emissions
from 1990-2022
decline in PM2.5 emissions
from 1990-2022
Cars and trucks are cleaner than ever
The cars, trucks and other vehicles on North Carolina highways emit far less pollution than older vehicles, thanks to improved engine and fuel standards and more advanced emissions controls.
From 1990 through 2022, CO, NOx, and VOC emissions have declined by 81%, 72%, and 85%, respectively, from these “on-road” sources of air pollution. The state expects to see further reductions from the transportation sector in the coming years due to the growing adoption of electric vehicles.
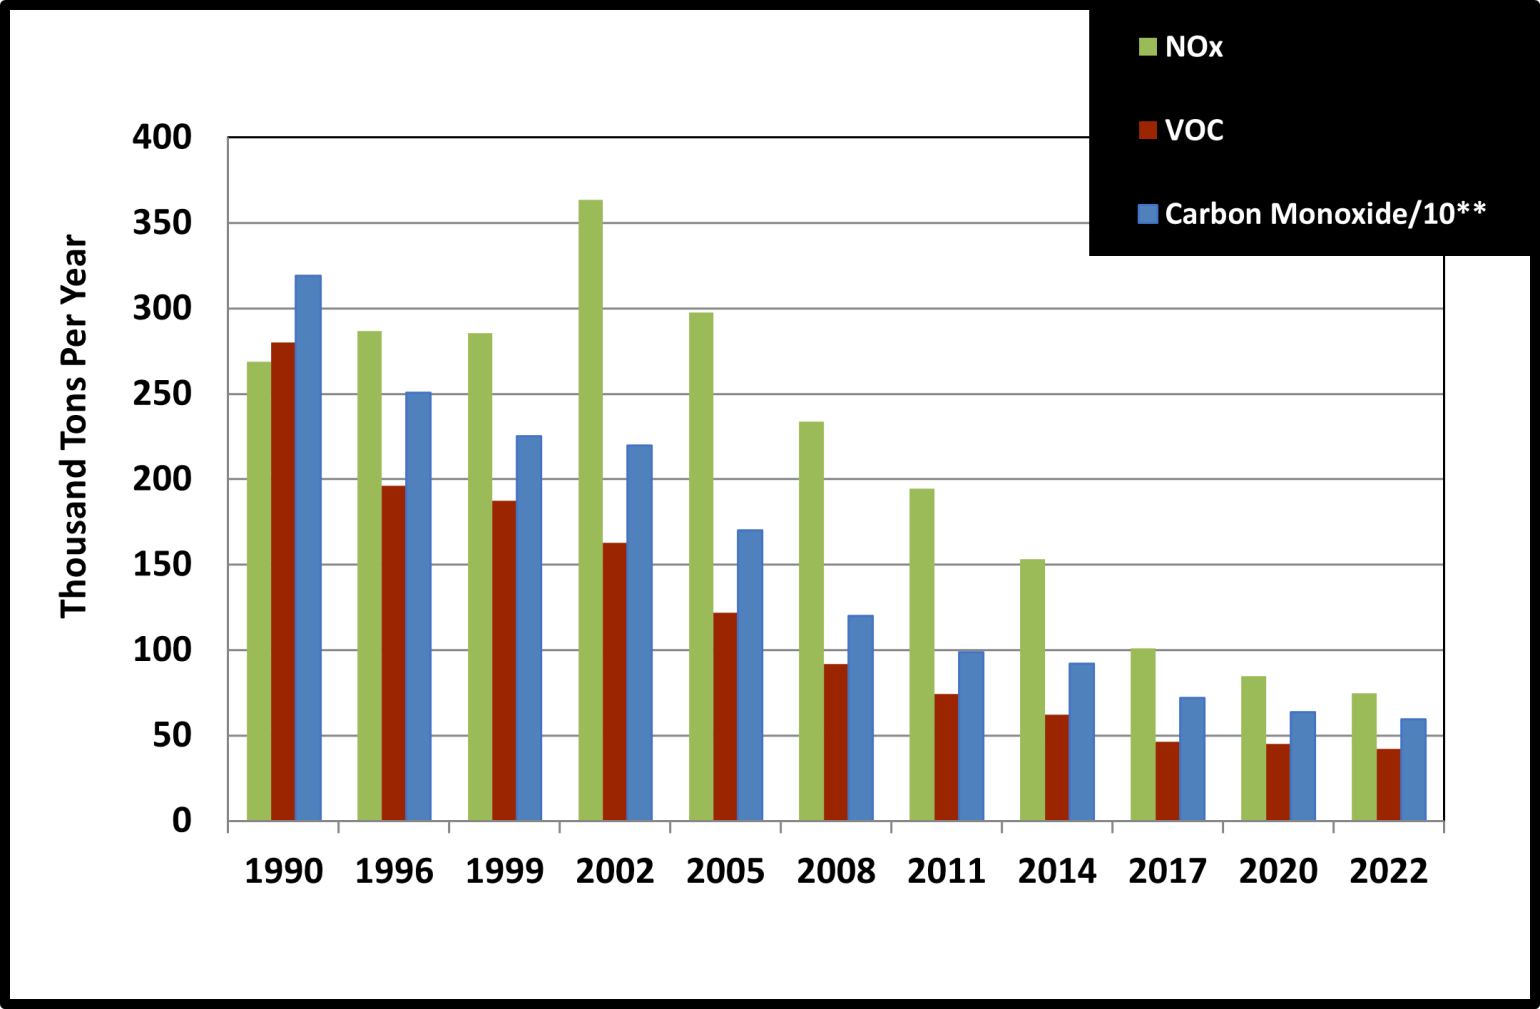
** CO emissions represented in this chart were divided by a factor of 10 for comparability purposes.
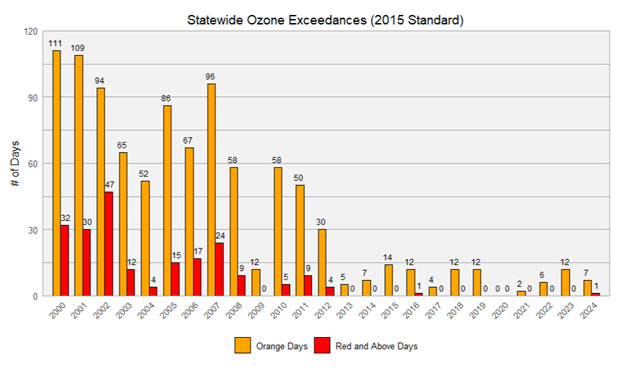
Outdoor air beats health-based standards
Air quality and visibility have substantially improved across North Carolina. Before 2009, extensive portions of North Carolina had tropospheric ozone levels exceeding the health-based standard. In August 2015, all areas of the state attained the National Ambient Air Quality Standards (NAAQS) for criteria pollutants established by EPA for the protection of public health and the environment.
As of 2024, average concentrations of criteria pollutants are well below each of the primary standards.
- Eight-hour CO concentrations were 83% below the limit.
- SO2 concentrations were 95% below the limit.
- One-hour NO2 concentrations were 71% below the limit.
- Annual NO2 concentrations were 89% below the limit.
- Eight-hour ozone concentrations were 13% below the limit.
- One-hour ozone concentrations were 41% below the limit.
- Twenty-four-hour PM2.5 concentrations were 53% below the limit.
- Annual PM2.5 concentrations were 20% below the limit.
- Twenty-four-hour PM10 concentrations were 78% below the limit.
As a result, we are seeing fewer "unhealthy" air quality days in the state. The number of ozone exceedance days statewide, in particular, continues to be low. From 2015-2024, North Carolina recorded just two days of “Code Red” or above for ozone in the state, compared to 83 such days from 2005-2014.
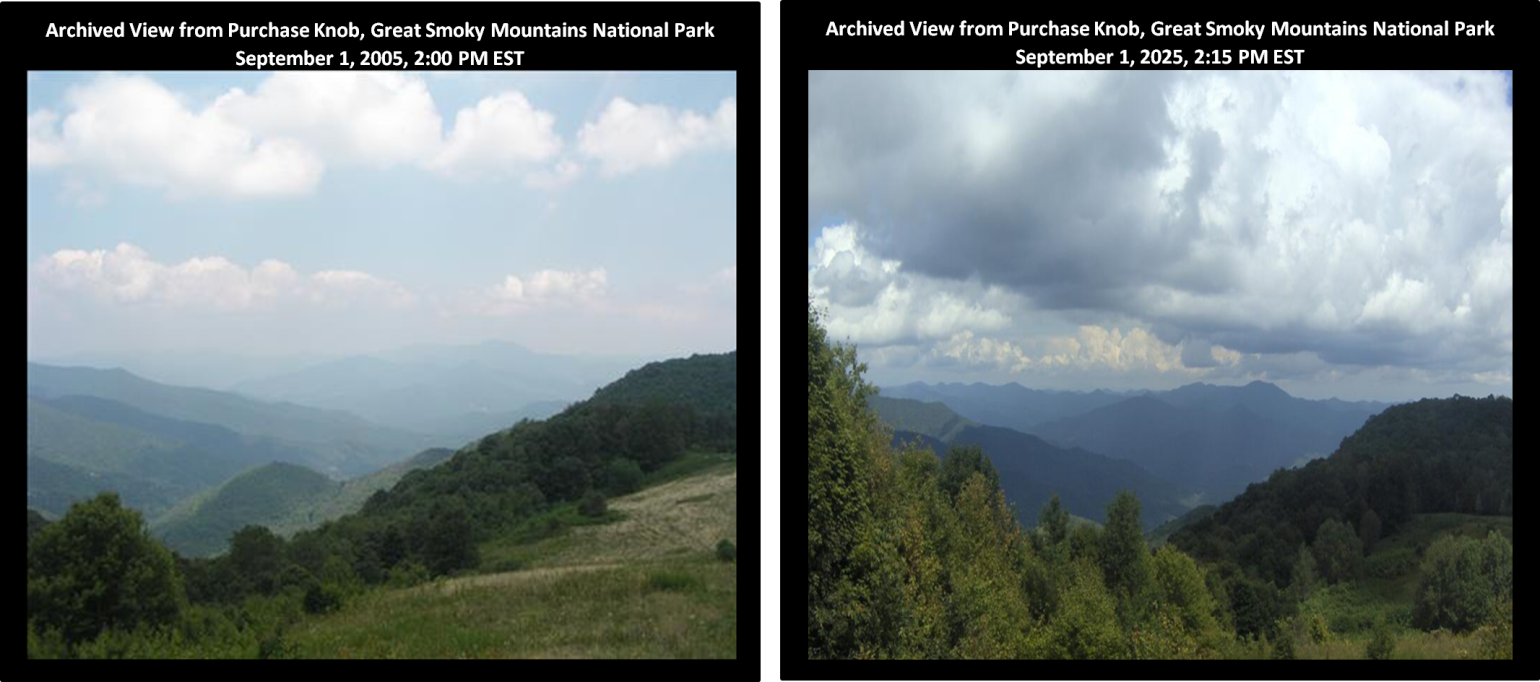
We have great views in the NC Mountains
The scenic panoramas of our national and state parks are clearer today due to reductions in SO2 and NOx emissions and other air pollutants that scatter light.
For example, in 2023, visitors could see as far as 119 miles at Great Smoky Mountains National Park during an average clear day, compared with just 54 miles in 1996.
Greenhouse gas emissions are also falling statewide
Net greenhouse gas emissions from fossil fuel combustion have decreased by 38% from 2005 to 2020 due to both a shift in fuel use and increased energy efficiency. During this same period, North Carolina’s population and real Gross State Product grew by 20% and 23%, respectively.
Greenhouse gas emissions from fossil fuel combustion have decreased by 21% from 2005 to 2020 due to both a shift in fuel use, from coal to natural gas and renewable energy, and increased energy efficiency. Methane (CH4) emissions accounted for approximately 12% of the total greenhouse gas emissions in 2020.
For more details about the state's greenhouse gas emissions, read our related report:
Previous Reports
Past DEQ reports about air quality trends are archived below.
- Air Quality Trends in North Carolina – September 2023
- Air Quality Trends in North Carolina – October 2020
- Air Quality Trends in North Carolina – December 2018
- Air Quality Trends in North Carolina – July 2016
- Air Quality Trends in North Carolina – June 2015
- Air Quality Trends Summary 1972-1989 – February 1991